Excel Pivot Table and Pivot Charts
PIVOT TABLES
A pivot table is a dynamic summary report of specified calculations generated from data a database. The database can be a table in the worksheet or in an external data file. It is called a PivotTable because the headings can be rotated around the data to view or summarize it in different ways.
The source data can be:
- An Excel worksheet database/list or any range that has labeled columns.
- The data in a PivotTable cannot be changed as it is the summary of other data. The data itself can be changed and the PivotTable recalculated. The PivotTable can be reformatted.
To create a PivotTable:
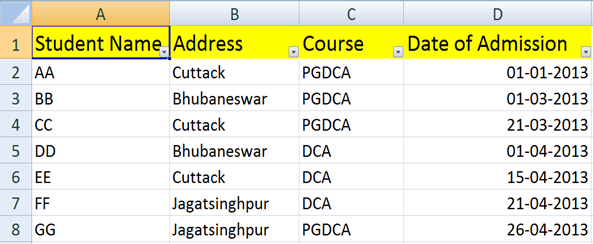
Now let us see Pivot table with the help of example. Suppose you have a data base of students records with various courses and want to see summarized data of student information per course then you can use Pivot table for it.
Steps:
- Prepare the MS Excel data sheet (table) and click any where it.
- Choose insert tab.
- Click on Pivot Table then Create Pivot Table dialog box will appear select with database table.
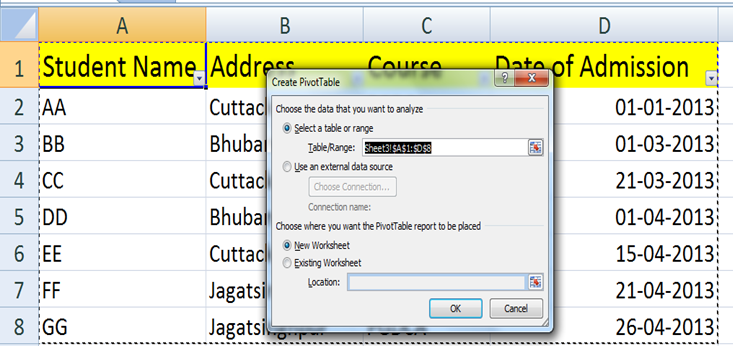
- You can choose worksheet where to insert Pivot Table, like New or Existing worksheet.
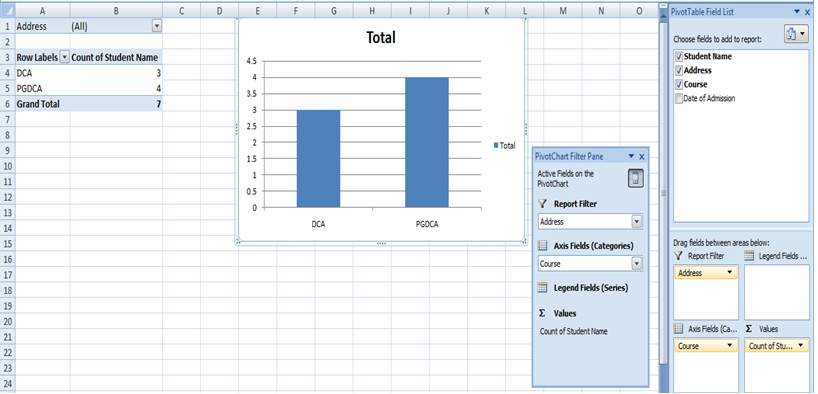
- Click on OK to insert Pivot table at your specified sheet and this will generate the Pivot table pane as illustrated below. You can select fields for the generated pivot table.
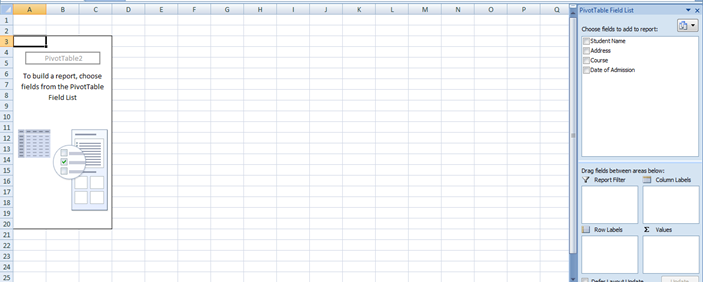
- In above there are various options available in Pivot table pane. You can select fields and drag into appropriate place for generated pivot table.
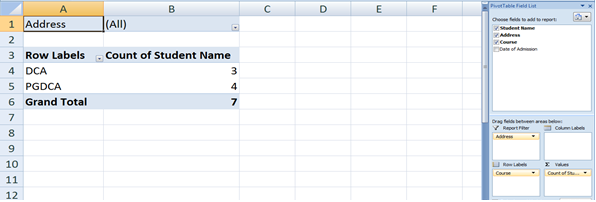
- Column labels: A field that has a column orientation in the pivot table. Each item in the field occupies a column.
- Report Filter: You can set the filter for the report as area (district) then data gets filtered as area wise.
- Row labels: A field that has a row orientation in a pivot table. Each item in the field occupies a row.
- Values area: The cells in a pivot table that contain the summary data. Excel offers several ways to summarize the data (sum, average, count, and so on).
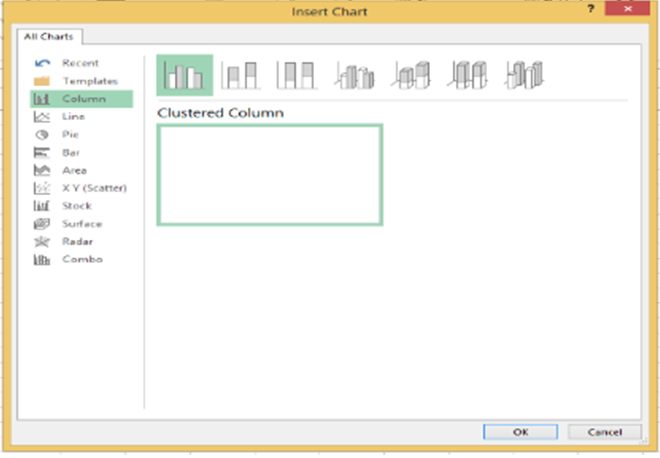
YOU CAN SELECT CHART IN PIVOT TABLE
A pivot chart is always based on result of a pivot table.
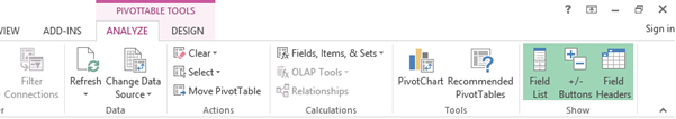
Pivot charts are available under Analyze tab when your cursor is on pivot table result.
When you click on PivotChart it will display insert chart dialog box as illustrated right.